8
As the environment in which businesses operate becomes more complex, skills
evolve and become obsolete more rapidly.
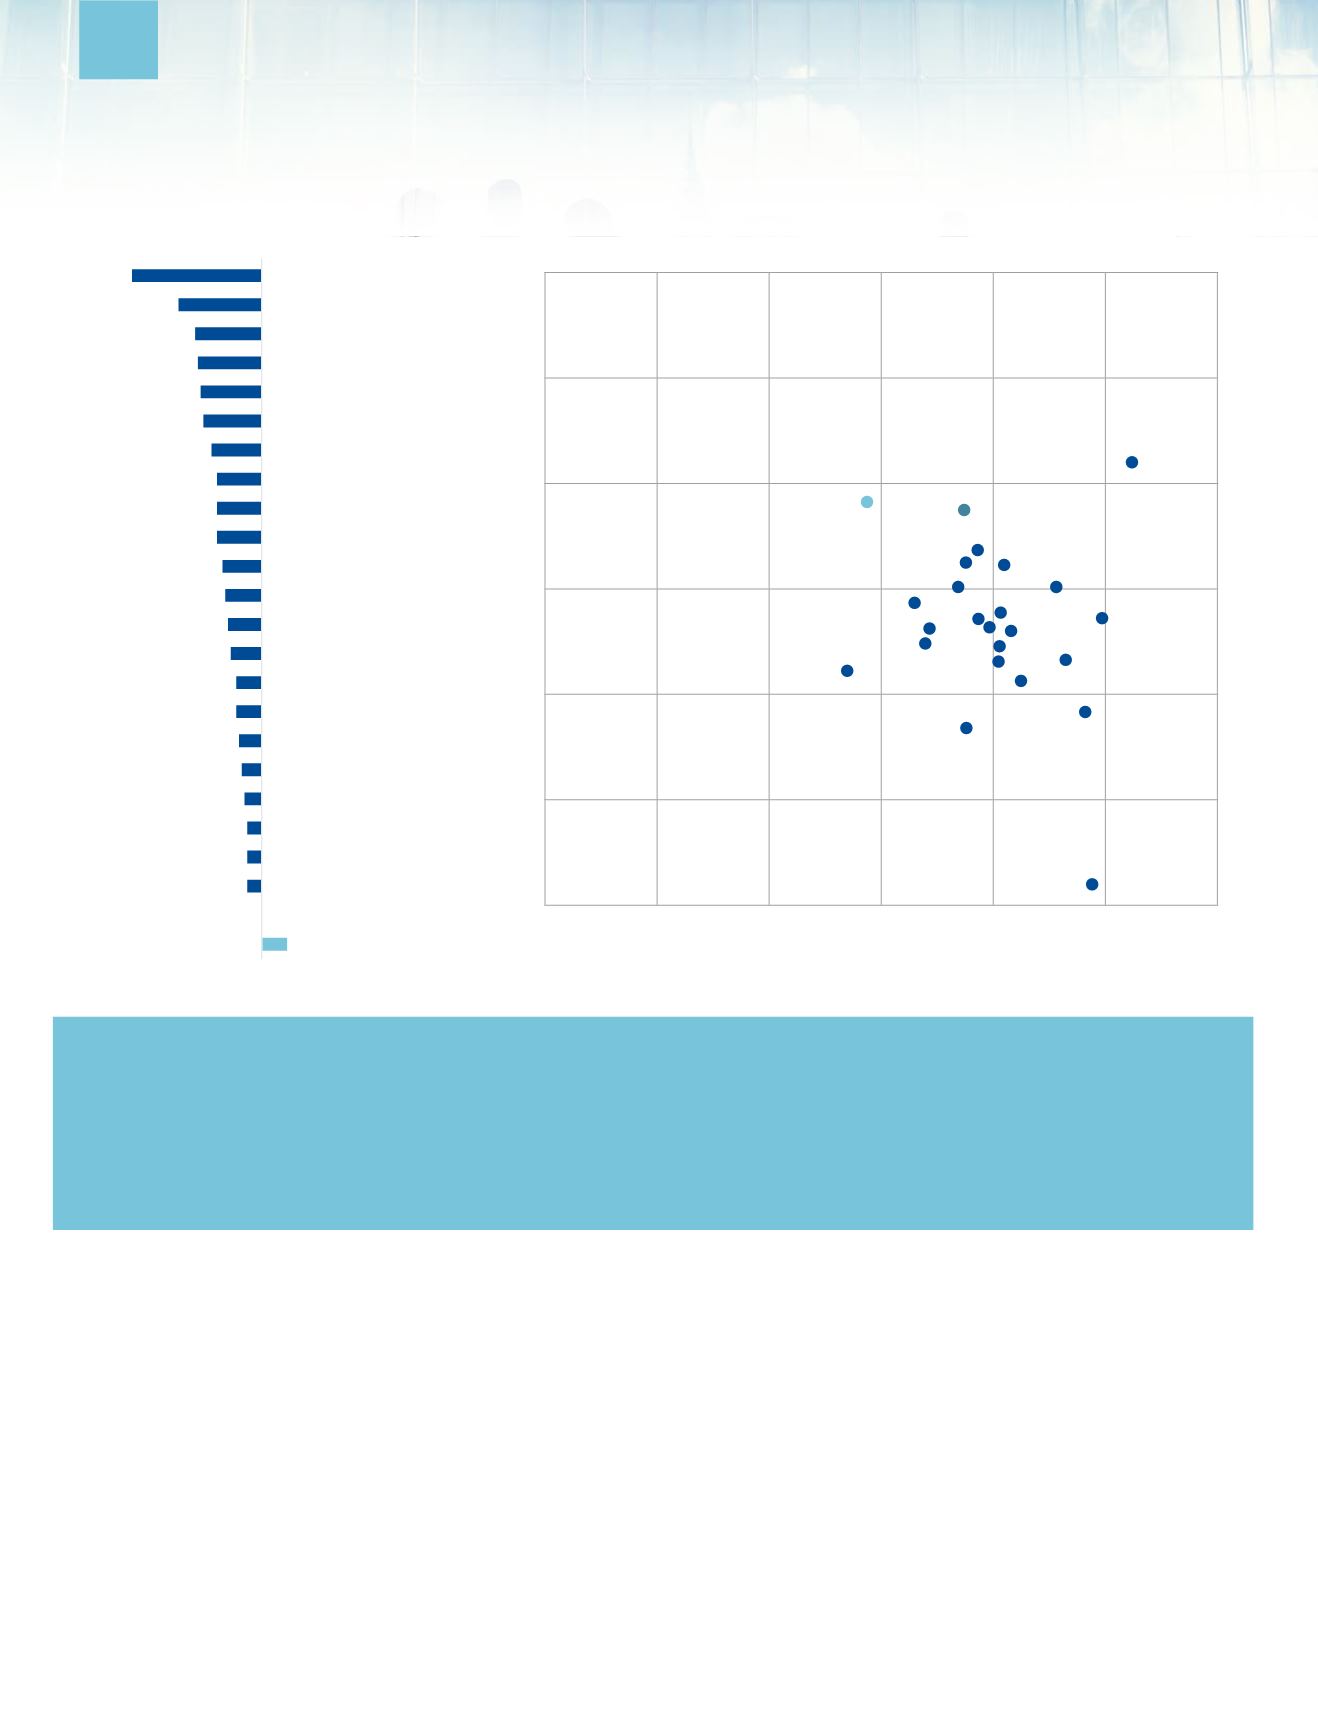
Our global Human Capital Trends 2014 survey suggests that respondents
clearly understand this challenge, with 75 percent rating workforce capabilities
as “urgent” or “important.” However, only 15 percent believe their companies
are “ready” to address the challenge. This gap is particularly wide in many major
economies, including Japan, Brazil, the United Kingdom, South Africa, and the
United States (figure 1).
Why the capability gap?
First, many organizations are looking in the wrong place, believing they can fill their
capability gaps by “hiring the right person” in their current markets. Yet this traditional
approach is increasingly a zero-sum game with as many losers as winners. Even if
companies can identify the right people, they must then attract them, compete with
others to hire them, and train them further once they are on the job. The reported
backlog of skills gaps appears to suggest the old way is no longer working.
Second, it takes many years to develop deep skills within the workforce. One major
oil company explained that, because of its long-standing investment in proprietary
processes and technologies, a new engineer requires five to seven years on the job
to become fully autonomous and productive.
3
Third, many companies have not built development programs that create capabilities
in a continuous way. Traditional learning and development programs, which typically
sprinkle training across the organization, are simply not dynamic enough. Robust
Workforce capability
Capability Gap Index (readiness — urgency)
Figure 1. Urgency vs. readiness: Who is leading, who is lagging?
Graphic: Deliotte University Press |
Japan
Brazil
United Kingdom
South Africa
United States
Netherlands
Canada
Australia
Belgium
Chile
Poland
All others
Portugal
Kenya
Ireland
India
Argentina
Mexico
Switzerland
Luxemburg
China
Uruguay
Germany
9
-47
-30
-24
-23
-22
-21
-18
-16
-16
-16
-14
-13
-12
-11
-9
-9
-8
-7
-6
-5
-5
-5
0
Spain
Capability gap grid
Spain
Germany
Chile
India
Switzerland
Mexico
Uruguay
Argentina
Ireland
Portugal
Poland
China
Belgium
South Africa
Australia
United Kingdom
United States
Japan
Netherlands
Canada
Brazil
All Others
Luxemburg
Kenya
0 = Not important
0 = Not ready
Important (66.6)
100 = Ready
70
60
50
40
30
30
40
50
60
70
Somewhat Important (33.3)
Somewhat ready (50)
100 = Urgent
The Human Capital Capability Gap Index
The Deliotte Human Capital Capability Gap Index is a research-
based index that shows HR’s relative capabilty gap in addressing
a given talent or HR-related problem. It is computed by taking
an organization’s self-rated “readiness” and subtracting it’s
“urgency”, normalized to a 0-100 scale. For example, if an
organization feels that an issue is 100 percent urgent and it
also rates itself 100 percent capable and ready to address
the issue, the capability would be zero. These gaps, which are
almost always negative, can be compared against each other.
The Capability Gap Grid
By plotting the gaps on a grid (with readiness on the vertical and
urgency on the horizontal), we can see how capability gaps vary
among different countries and industries.
• Capability gaps at the lower right part of the grid are those
of high urgency and low readiness (areas that warrant
major increases in investment).
• Capability gaps at upper right part of the grid are highly
urgent, but companies feel more able to perform in these
areas (they warrant) investment but are lower priority that
those at the bottom right).
• Capability gaps on the left side of the grid are areas of
lesser importance, and those lower on the grid are areas
of less readiness.


