34
NCRWA.COM |
Spring 2014
feature
Mike told us about the new sampling sites
installed in the system for taking Bac-T
samples. The sampling sites look similar to
stand-alone telephone utility boxes, and are
positioned at strategic locations along the
distribution lines. Typically, only the larger
municipal systems have these, and they
really simplify taking samples.
Elizabethtown is also in the process of
updating its wellhead protection plan. The
Town will use public education to help
limit the potential for accidental spills or
leaks within the two wellhead protection
areas. Wells one through four are within or
adjacent to the town limits, and are in close
enough proximity to one another that a single
wellhead protection area protects them all.
Well 5 is located south of the town limits in
a more rural area, and has its own circular
wellhead protection area (Figure 3).
Figure 3
Elizabethtown Wellhead
Protection Areas
Having a wellhead protection plan is a good
investment in the health and protection of
the wells. The plans cost almost nothing but
the effort of the water system, because NC
Rural Water Association has technicians to
facilitate the development of the plan. The
idea is make local business and industry
aware of the fact that public water supply
wells are located nearby, and that best
management practices can prevent spills or
leaks. Spills and leaks not only threaten the
wells, but cost the owner in lost product and
revenue. Having a state-approved wellhead
protection plan also gives priority points to
the water system when applying for a low-
interest loan through the State Revolving
Fund. Call Rural Water if your system
is interested in a (mostly free) wellhead
protection plan.
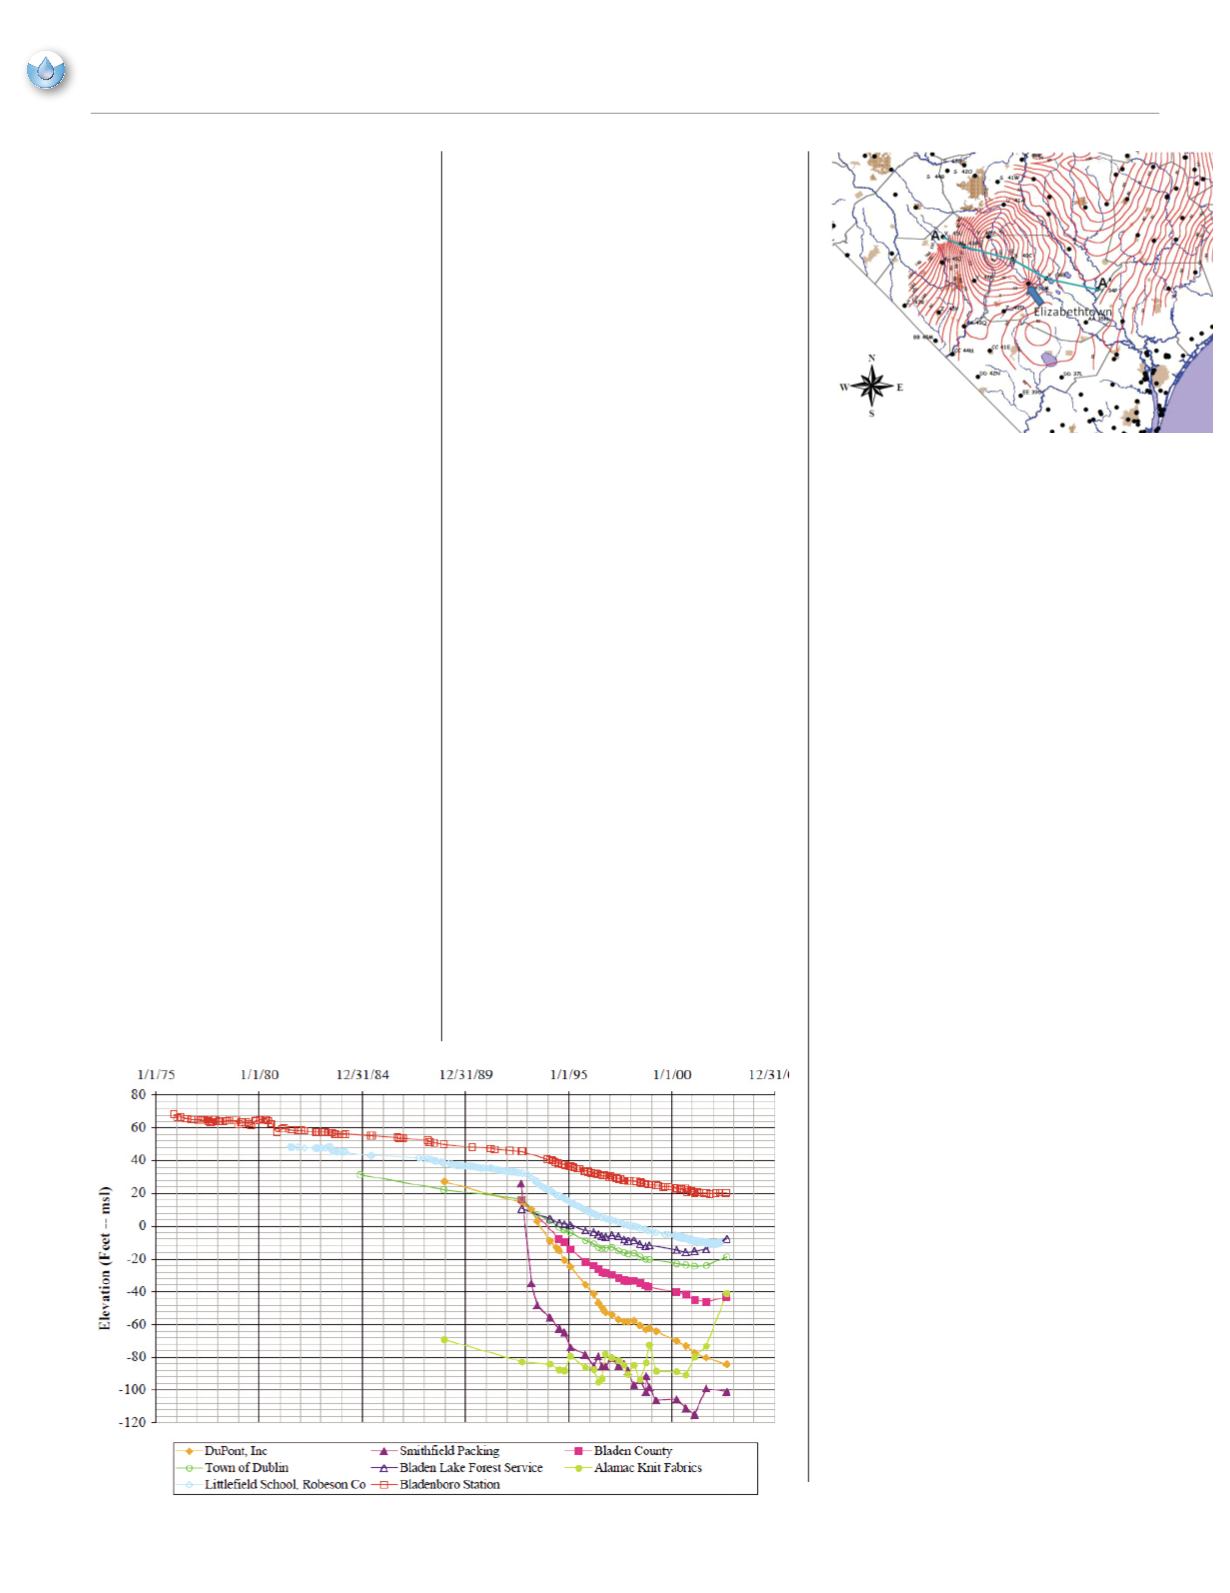
The Upper Cape Fear aquifer has been a
cause for concern due to declining water
levels. The United States Geological Survey
(USGS) and the North Carolina Division of
Water Resources (DWR) have been tracking
the head levels of the aquifer using a series
of monitoring wells scattered across Bladen
County. In the early ‘90’s static water levels
began declining at an increased rate because
of increased withdrawals. Figure 4 shows
a DWR hydrograph of observation wells
from 1975 through 2002. The water levels
show an initial steady decline over a ten-year
period that becomes increasingly steep in the
early ‘90’s. The closer the well is located
to the cone of depression, the steeper its rate
of decline.
Figure 4
Hydrograph of various wells screened
in the Upper Cape Fear aquifer from
1976 through 2002
The monitor well network water levels
showed that the water pressure in the Upper
Cape Fear aquifer fell in response to increased
pumping, creating a large cone of depression
centered on wells used by business and
industry northwest of Elizabethtown (Figure
5). Static water levels near the center of
the cone of depression have declined to
near the top of the Upper Cape Fear clay
confining unit. Continued pumping could
eventually dewater the aquifer or cause
saltwater encroachment. The lower portions
of the Cretaceous aquifer system are saltier
with depth, because salt water has a higher
density than fresh water. Over pumping can
cause upwelling of the saltwater-freshwater
interface, and the intake of saltwater.
Figure 5
Upper Cape Fear aquifer head
showing large cone of depression in
northwestern Bladen County
The good news for Elizabethtown is that in
the mid ’90’s the rate of static water level
decline was reduced substantially until
1999-2000, when water levels equilibrated,
except for areas near the center of the cone
of depression. Elizabethtown can be seen
just on the eastern edge of the large cone of
depression. Also good for the water system
is the fact that the Upper Cape Fear is not the
sole source aquifer for the Town. The Line
from A to A’ on Figure 5 is shown in cross
section (Figure 6) and depicts the location of
Elizabethtown’s wells, which are currently at
the edge of the cone of depression.
The cross section shows the head level
(potentiometric surface) as a red line. Water
Figure 4
Figure 5


