


 23 / 40

Winter 2015
NCRWA.COM21
feature
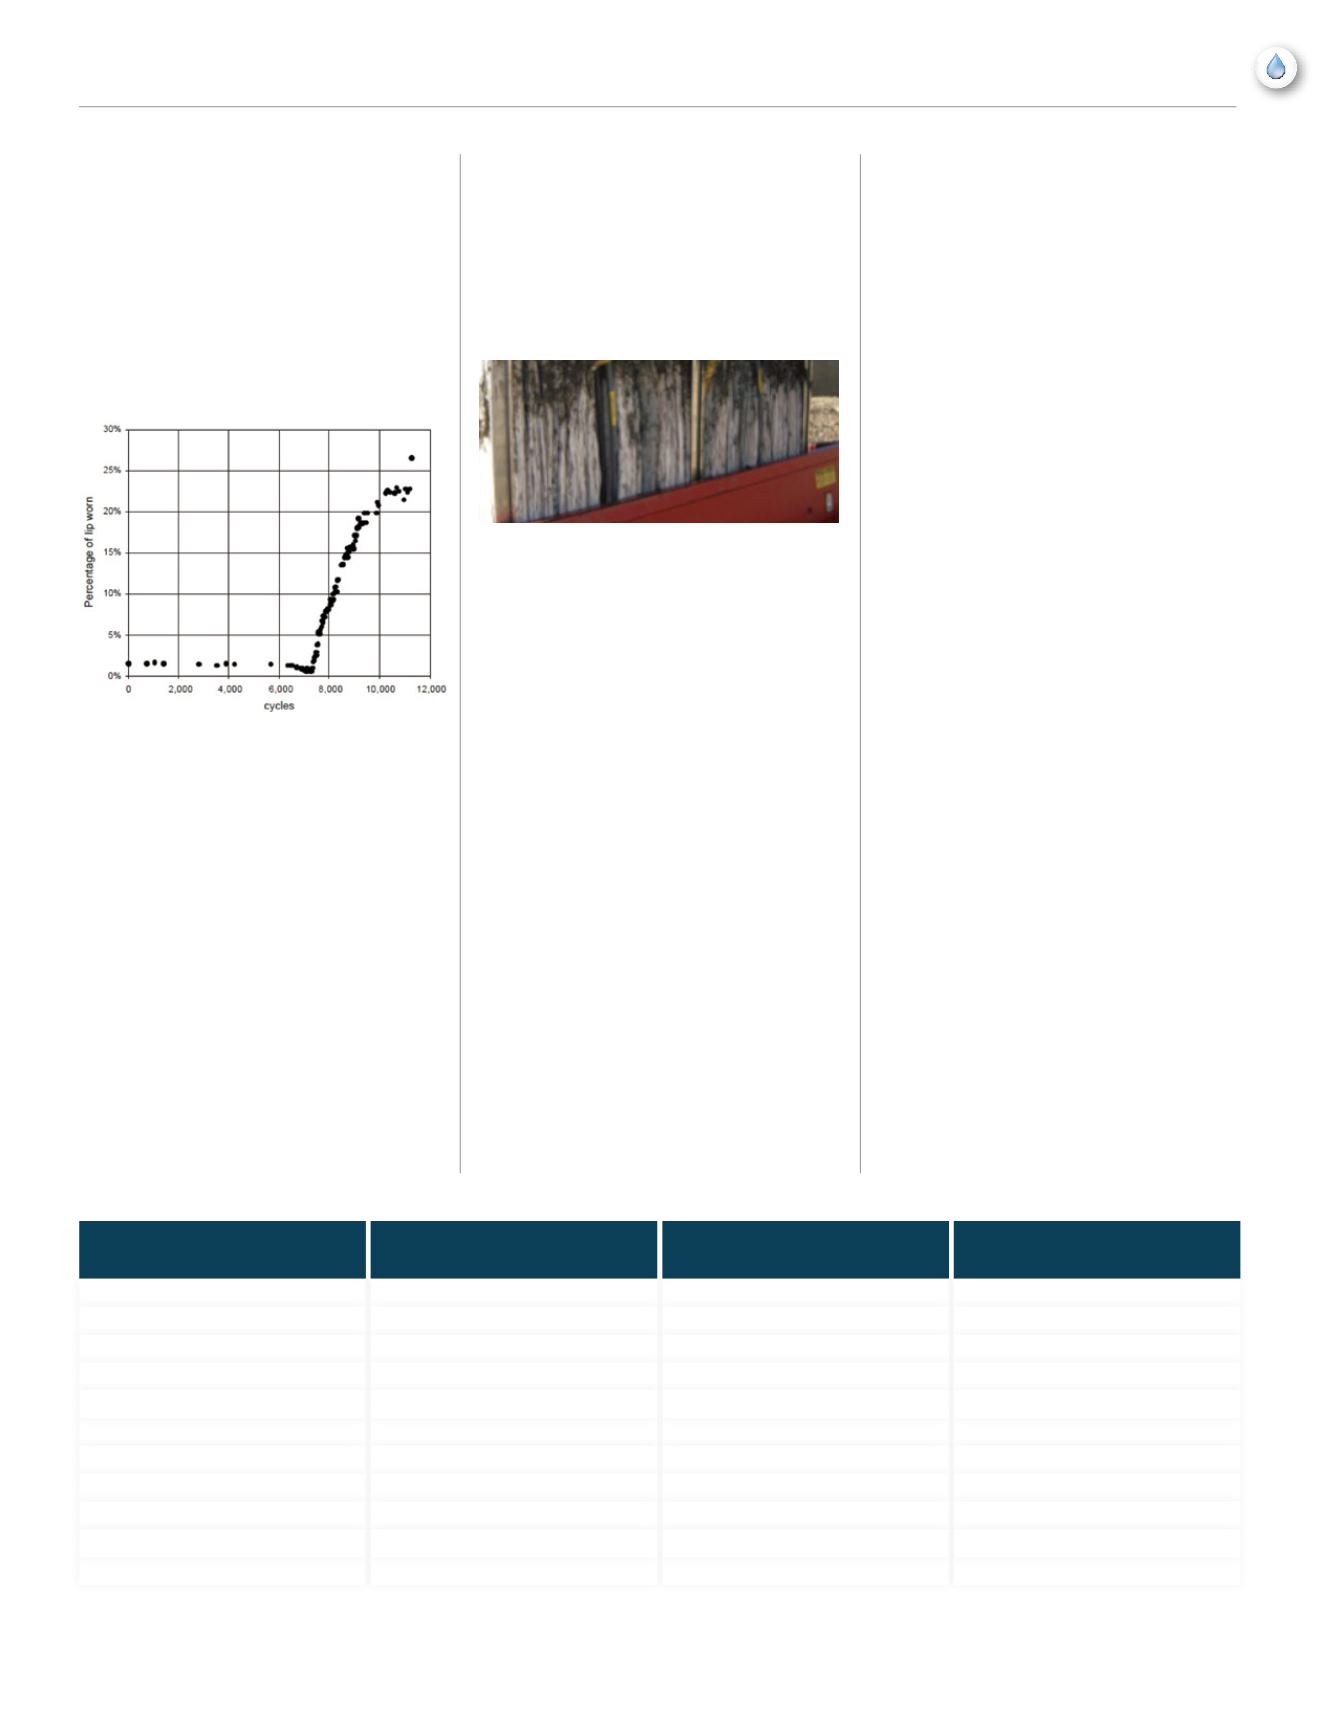
cycles of operation is shown. Seal wear is
measured as the percentage of the seal lip that
the abrasive slurry has penetrated. Note that
there are two distinct regions of operation.
The break-in period of wear is characterized
by a very low wear rate and can be seen as
the region from 0 to 7,000 cycles of operation.
The aggressive wear period occurs after 7,000
cycles of operation.
Figure 2:
Seal Failure Example
Rotary Type Seals (Dynamic Seals)
Will Fail—It’s Inevitable
Seals employed on rotating elements will
ultimately fail. It is only a matter of when.
Rotating seals begin to wear from the moment
they are put into service. The rate of wear
is highly variable depending on: the seal
materials used in their manufacture; the nature
of the debris to which the seals are exposed;
the accuracy of the seal alignment with
mating surfaces; the smoothness of the mating
surfaces; average operating temperatures;
exposure to certain chemical substances;
exposure to sunlight; and, of course, the age of
the seals. The complexity of these interacting
factors make it difficult to predict the life of
a seal in a rotating application. Leakage from
wear, elongation or physical damage can easily
go undetected and potentially cause initially
imperceptible damage to downstream process
such as membranes
(see figure 3)
.
Figure 3:
A membrane filter damaged by over-
sized debris as a result of seal leakage.
Fixed-Element Seals are an
Option for Critical Applications
Fixed-element or static seals—seals which
do not move—are perhaps the best option for
applications that require an absolute barrier to
debris. Perforated screens with fixed-element
seals move the cleaning mechanism rather
than the perforated metal screen and thereby
eliminate any opportunity for incremental
leakage or catastrophic seal failure, such
as can occur when using a dynamic sealing
strategy. In contrast, sealing integrity is
absolute with a static seal as there are no
cycling variances; no abrasive effects, and no
potential for incremental leakage.
Given the capital expense of membrane
technology in relation to the cost of protective
screening, one can expect a trend toward
static sealing strategies.
Seal Material Overview
2
Natural Rubber:
Features:
Natural Rubber features high tensile
strength; high resilience, high abrasion and
high tear resistance properties, with a good
friction surface and excellent adhesion
to metals. Natural Rubber features good
resistance to organic acids and alcohols, with
moderate resistance to aldehydes.
Limitations:
Not widely used in sealing industry
due to poor compression set performance at
elevated temperature and lack to resistance to
petroleum based fluids.
Ethylene propylene:
Features:
When compounded using peroxide
curing agents, high temperature service can
reach +302°F. Good resistance to acids and
solvents (i.e. MEK and Acetone).
Limitations:
Have no resistance to
hydrocarbon fluids.
Chloroprene (Neoprene®):
Features:
Neoprene can be used in
innumerable sealing applications due to
its broad base of such desirable working
properties as: good resistance to petroleum
oils; good resistance to ozone, sunlight and
oxygen aging; relatively low compression
set; good resilience; outstanding physical
toughness; and reasonable production cost.
Limitations:
Neoprene
®
is generally attacked
by strong oxidizing acids, esters, ketones,
SEAL MATERIAL
TEMPERATURE RANGE
Degrees F
HARDNESS/DUROMETER
Shore A*
TENSILE STRENGTH
Characteristics**
Natural Rubber
-58 to +158
40 to 90
G-E
Ethylene Propylene
-40 to +225
40 to 95
G
Chloroprene (Neoprene®)
-40 to +250
40 to 90
F
Nitrile (Buna-N)
-40 to +257
40 to 90
G
Nitrile (Hydroginated)
-30 to +300
50 to 90
G-E
Polacrylate
-25 to +300
40 to 90
F
Flurosilicon
-75 to +600
40 to 80
P
Flurocarbon (Viton®)
-13 to +446
55 to 90
F
Silicon Rubber
-85 to +400
5 to 80
P
Butyl Rubber
-50 to +250
40 to 90
F-G
Polyurethane
-30 to +175
70 to 90
E
*Shore A scale: 100=the hardness of glass or steel—scale is not proportional.
**E=Excellent, G=Good, F=Fair, P=Poor
Chart A